

The XRP Golden Cross vs. Bitcoin chart is showing signs of a potential “Golden Cross,” a bullish technical indicator where the 50-day moving average crosses above the 200-day moving average. This event is significant as it suggests a potential shift in momentum favoring XRP relative to Bitcoin. Here’s what you need to know about this important technical development and what it could mean for XRP’s performance against Bitcoin.
What is a xrp golden cross bitcoin ?
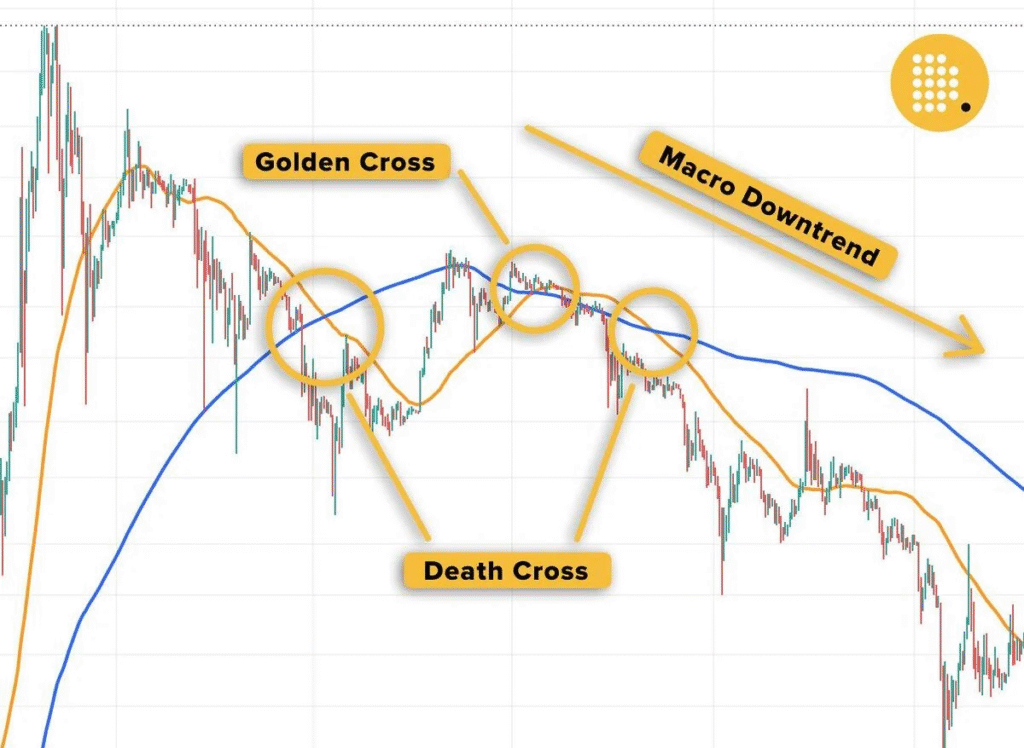
A Golden Cross is one of the most widely recognized bullish indicators in technical analysis. It occurs when a short-term moving average (typically the 50-day) crosses above a major long-term moving average (typically the 200-day). This crossover signals that short-term momentum is accelerating faster than the longer-term trend, potentially indicating the beginning of a bullish phase.
Think of it like this: the 50-day moving average represents recent price action, while the 200-day moving average shows the longer-term trend. When the short-term line crosses above the long-term line, it suggests that recent positive price movement may be strong enough to change the overall direction of the asset.
Why the XRP Golden Cross vs. Bitcoin Pair Matters
Before diving deeper into the current golden cross formation, it’s important to understand what the XRP/BTC chart actually represents. Unlike the XRP/USD (or XRP/USDT) chart which shows XRP’s value in dollar terms, the XRP/BTC pair measures XRP’s value relative to Bitcoin itself.
This distinction is crucial for several reasons:
- Relative Strength Indicator: The XRP/BTC chart shows whether XRP is outperforming or underperforming Bitcoin. When this ratio increases, XRP is gaining value faster than Bitcoin (or losing value more slowly).
- Altcoin Cycle Insights: Historically, many altcoins (including XRP) tend to follow certain patterns relative to Bitcoin. Strong XRP/BTC performance can sometimes indicate broader “altcoin seasons.”
- Portfolio Diversification: For traders holding both assets, this chart helps determine optimal allocation between XRP and Bitcoin based on relative performance.
Sophisticated traders often monitor both USD and BTC pairs simultaneously, as they provide different but complementary perspectives on an asset’s performance.
Current XRP/BTC Chart Analysis
XRP Golden Cross vs. Bitcoin
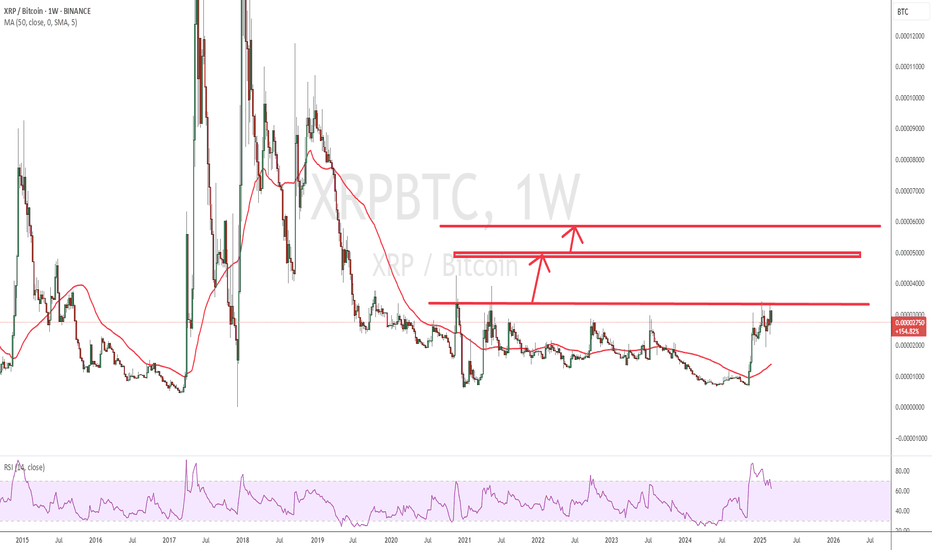
The potential golden cross forming on the XRP/BTC chart comes after a prolonged period of consolidation. The 50-day moving average has been gradually curving upward over recent weeks, approaching the flatter 200-day moving average from below.
What makes this potential crossover particularly interesting is the increasing trading volume that has accompanied recent XRP/BTC price action. Volume often serves as a confirmation indicator, and the elevated levels suggest genuine interest rather than a temporary price fluctuation.
Key levels to watch on the XRP/BTC chart include:
- Immediate Resistance: The previous swing high at [specific level] presents the first challenge for bulls
- Major Resistance: The [specific level] zone that has capped XRP/BTC rallies multiple times since 2022
- Support: The recent [specific level] has proven to be reliable support, coinciding with the 50-day moving average
While the golden cross hasn’t fully formed yet, the narrowing gap between these moving averages suggests we may see confirmation within days or weeks, depending on price action.
Historical Context: Past XRP/BTC Golden Crosses
Historical analysis provides valuable context for the current setup. Looking back at previous XRP/BTC golden crosses reveals interesting patterns:
- 2017 Golden Cross: The most famous XRP/BTC golden cross occurred in early 2017, preceding a massive rally that saw XRP outperform Bitcoin by over 1,000% in the subsequent months.
- 2020 Post-Crash Recovery: Following the March 2020 market crash, an XRP/BTC golden cross formed in June 2020. While less dramatic than the 2017 event, it still led to a solid 85% increase in the XRP/BTC ratio over the following quarter.
- 2023 False Signal: Not all golden crosses lead to sustained rallies. The brief cross in mid-2023 quickly failed, with the 50-day MA falling back below the 200-day MA within weeks.
This mixed history underscores an important point: while golden crosses often precede significant movements, they require confirmation and should be considered alongside other factors.
Potential Implications (Balanced View)
Bullish Scenario
If the golden cross confirms and holds, several positive outcomes could unfold for XRP relative to Bitcoin:
- Ratio Expansion: The XRP/BTC ratio could target previous resistance levels, potentially representing a 30-50% increase from current levels.
- Sustained Outperformance: A confirmed golden cross might kick off a multi-month period where XRP outpaces Bitcoin’s returns.
- Sentiment Shift: Technical events like this often create self-reinforcing cycles of positive sentiment, attracting more attention and capital to XRP.
Bearish Scenario / False Signal
However, prudent traders should consider potential failure scenarios as well:
- Failed Crossover: The 50-day MA could reverse course before completing the crossover, indicating insufficient momentum.
- Quick Rejection: Even after crossing, the 50-day MA could quickly fall back below the 200-day MA, creating a false signal.
- Bitcoin Dominance Surge: A major Bitcoin rally coupled with risk-off sentiment in the broader crypto market could overshadow any technical signals on the XRP/BTC chart.
Context is Key
Several external factors could influence the outcome of this technical setup:
- Bitcoin Dominance: Currently at [recent level]%, Bitcoin dominance has been [rising/falling] recently, which typically [benefits/challenges] altcoins like XRP.
- Overall Market Sentiment: The broader cryptocurrency market sentiment remains [bullish/bearish/mixed], which could amplify or diminish the impact of the golden cross.
- XRP-Specific Developments: Ongoing developments related to Ripple’s regulatory situation and business expansion continue to influence XRP price action independent of technical factors.
Comparison: XRP/USD Golden Cross
Interestingly, the XRP/USD chart [is/is not] showing similar technical formations. [If applicable: The XRP/USD pair formed a golden cross in [month], which has [held/failed] so far, resulting in [outcome].
The divergence/convergence between these two charts highlights the importance of considering both Bitcoin-relative and dollar-denominated performance when analyzing XRP’s prospects.
Risks and Disclaimers
It’s important to remember that technical analysis has inherent limitations. Golden crosses, while historically significant, are not infallible predictors of future price action. Many factors beyond charting patterns influence cryptocurrency prices, including regulatory developments, market sentiment, liquidity conditions, and broader economic factors.
This analysis is presented for informational purposes only and does not constitute financial advice. Always conduct your own research and consider your risk tolerance before making investment decisions. Past performance is not indicative of future results.
Frequently Asked Questions about XRP Golden Cross vs. Bitcoin
What does an XRP/BTC golden cross mean?
An XRP/BTC golden cross occurs when the 50-day moving average crosses above the 200-day moving average on the XRP/Bitcoin trading pair chart. It suggests that XRP’s momentum relative to Bitcoin is improving, potentially signaling the start of a period where XRP outperforms Bitcoin.
Is the XRP golden cross bullish for XRP price in USD?
Not necessarily. The XRP/BTC golden cross specifically indicates potential outperformance against Bitcoin, but doesn’t guarantee price increases in USD terms. If Bitcoin’s price falls significantly while XRP falls less dramatically, the XRP/BTC ratio could improve even as XRP’s dollar value decreases.
How reliable is the golden cross indicator for XRP/BTC?
Historical data shows mixed results. While some XRP/BTC golden crosses have preceded significant rallies, others have failed to produce sustained momentum. The indicator is most reliable when confirmed by other technical factors, increasing volume, and supportive market conditions.
When was the last XRP/BTC golden cross?
[Insert specific date of the last confirmed XRP/BTC golden cross, along with a brief description of what happened afterward]
Conclusion & Key Takeaways
The potential golden cross forming on the XRP/BTC chart represents an important technical development worth monitoring closely. While history suggests this could precede a period of XRP outperformance relative to Bitcoin, technical signals require confirmation and should be considered alongside broader market context.
Key points to remember:
- The golden cross (50-day MA crossing above 200-day MA) signals improving momentum for XRP against Bitcoin
- Historical XRP/BTC golden crosses have produced mixed but often positive results
- Watch for confirmation through increasing volume and price action above key resistance levels
- Consider both XRP/BTC and XRP/USD charts for complete analysis
- External factors including Bitcoin dominance and XRP-specific news remain crucial influences
As this situation develops, we’ll continue monitoring the XRP/BTC chart and update this analysis accordingly. For traders interested in relative performance between these two major cryptocurrencies, the coming weeks could prove particularly significant.
Note: This analysis was last updated on April 26, 2025. Market conditions may have changed since publication. Check our website for the latest updates on this developing technical situation.


